Our data sets


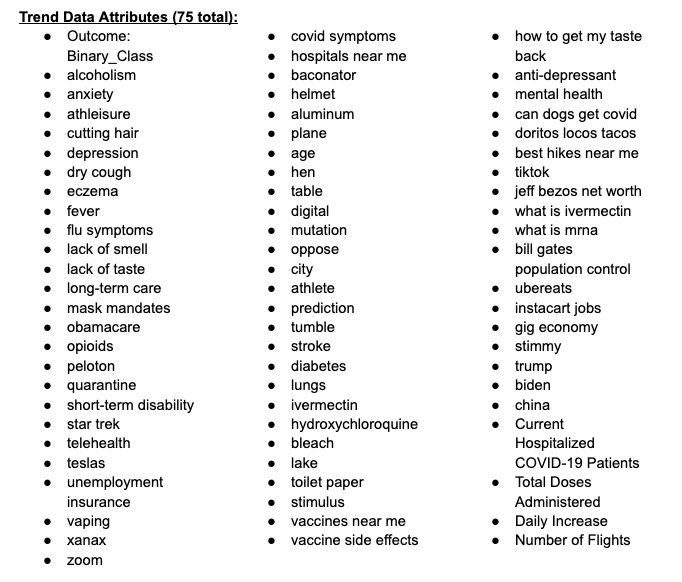
Google Trend Data and Stock Data

Data Source: Stock Data
Data Source: Flight Data
Data Source: Vaccination and Hospitalization Data
Date Range of Data: December 1st, 2019 - February 15th, 2022

What stock data we choose?

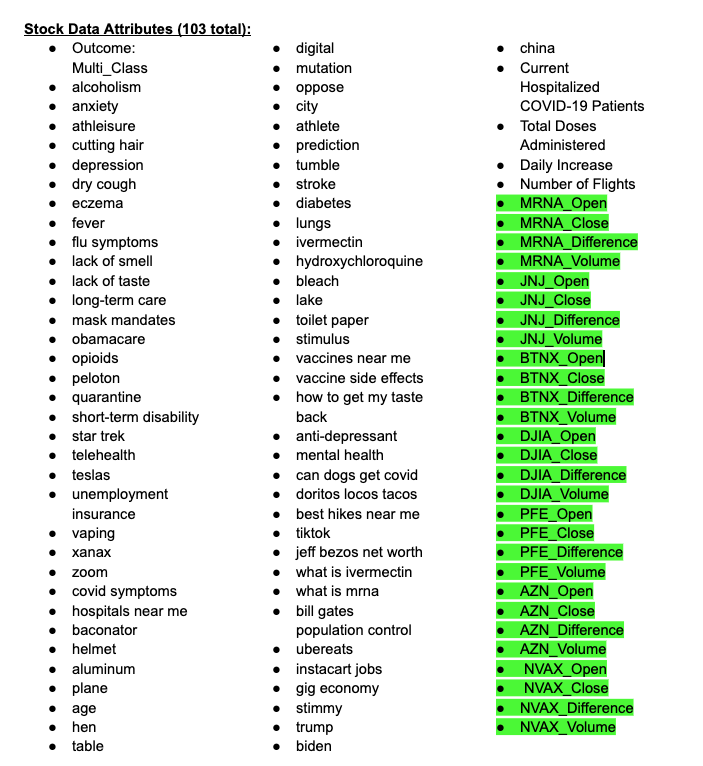
We decided to use the daily opening and closing stock price, the change in price for the day, and the volume traded from companies that produced vaccines. These companies are Moderna, Pfizer, BioNTech, AstraZeneca, and Johnson and Johnson. We also decided to use the same values from the Dow Jones Industrial Average to get an overall scope of the market daily.

*Attributes highlighted in Green are the stock data attributes
Pytrends


Google Trends Python Library

Pytrends Documentation: Pypi Pytrends

What is Pytrends?

PyTrends is a python library that utilizes Google Trends data. Google Trends returns the popularity or "trend" of a search result. The trend returned gives a score between 0-100 for each day for the specified time period. The score for each day is relative to the time period. A score of 100 means that day was when users Googled the search term the most out of the given time period. If multiple search terms are provided in one call, the search scores are compared not only to the time period but between the two terms as well.

Data Binning and Cleaning


Cleaning Our Data

How did we clean our data?

The data that we pulled was fairly clean from the start. One of the challenges we came across when handling this data was that we wanted to add lag to some of the columns of data but keep other columns on their actual date collected. For example, we added 10 days of lag to all the search data because if someone was searching for a key word or words on google, we assumed that person would not die that day. We did not add any lag to any of the stock data because as the covid deaths were being reported for the day, the stock prices could react accordingly. It would not take days for the prices to change.

Outcome Binning

Data Source: CDC COVID-19 Dealths
Date Range of Data: January 23rd, 2020 - February 22nd, 2022

Why did we bin our data?

We binned our data due having a limited number of total observations or days of data (763 total) in the data set. Given these constraints determined our binning approaches to test two different outcomes. Binary (low/high) and Multi-Class outcomes.
Binary binning was done based on the average deaths in the data set of around 1,200 per day and binned into low or high.
The multi-class binning placed the data into 3 ranges determined by the daily death quartiles of 25%, 50%, and 70% percentiles. The corresponding bins are 0-549, 550-1698, 1600+ daily deaths.

Binning Outcomes (Daily Deaths)

Binary:
  • Number of Low Observations: 457
  • Number of High Observations: 306

  • Multi-Class Outcomes:
  • Number of Observations 0-549: 382
  • Number of Observations 550-1698: 192
  • Number of Observations 1699-5000: 189